Empower Your Trading with Multi Time Frame Support & Resistance Indicator
Introduction:
Understanding support and resistance levels is crucial for traders seeking to navigate the markets effectively. However, manually identifying these levels across various timeframes and currency pairs can be time-consuming and prone to errors. That’s where our innovative Multi Time Frame Support & Resistance Indicator comes in, offering a comprehensive solution tailored to your trading preferences.
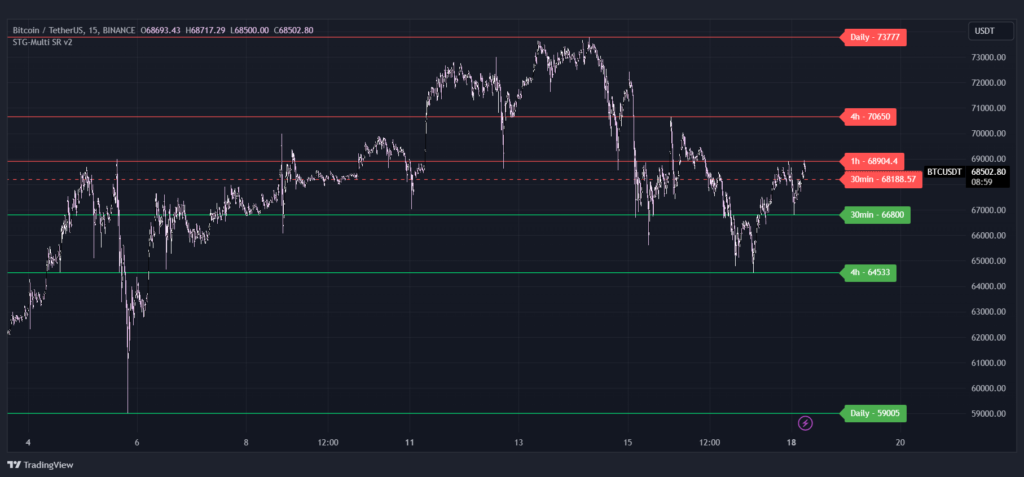
What is Support & Resistance:
Support and resistance levels represent key price levels where a significant number of buyers (support) or sellers (resistance) are concentrated. These levels act as barriers to price movement and play a pivotal role in determining market direction.
Why Support & Resistance Matters:
For traders, support and resistance levels are essential as they provide valuable insights into market sentiment and potential price reversals. Understanding these levels enables traders to make informed decisions, identify entry and exit points, and manage risk effectively.
Challenges of Manual Identification:
Manually identifying support and resistance levels across different timeframes and currency pairs is arduous and prone to subjectivity. Our indicator alleviates this challenge by accurately pinpointing these levels with just a click, tailored to your personalized settings, saving you time and ensuring precision across all relevant timeframes.
The Solution We Offer:
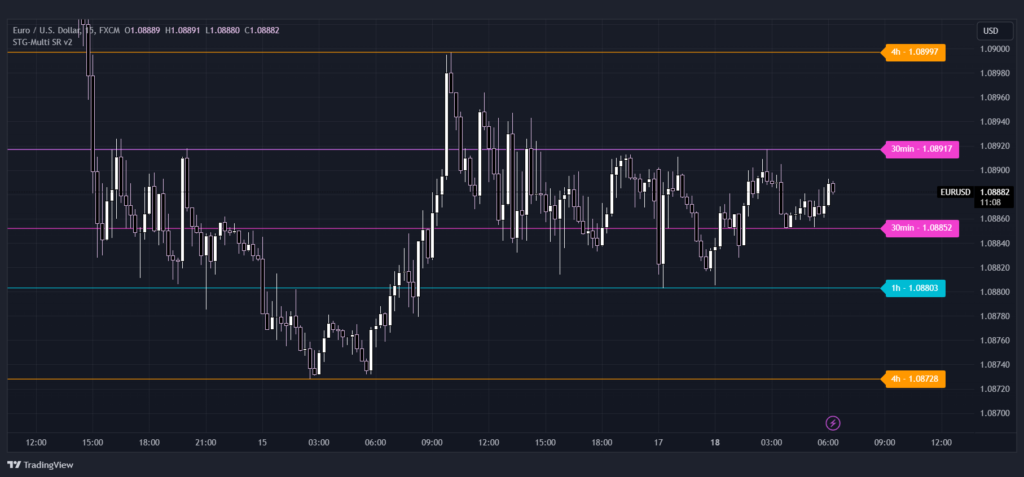
Our indicator offers a tailored solution, accurately identifying support and resistance levels based on your unique trading preferences. With customizable input parameters, you can fine-tune the indicator to align with your trading strategy. Moreover, it operates across multiple timeframes, providing a comprehensive view of support and resistance levels.
how to use :
General Settings:
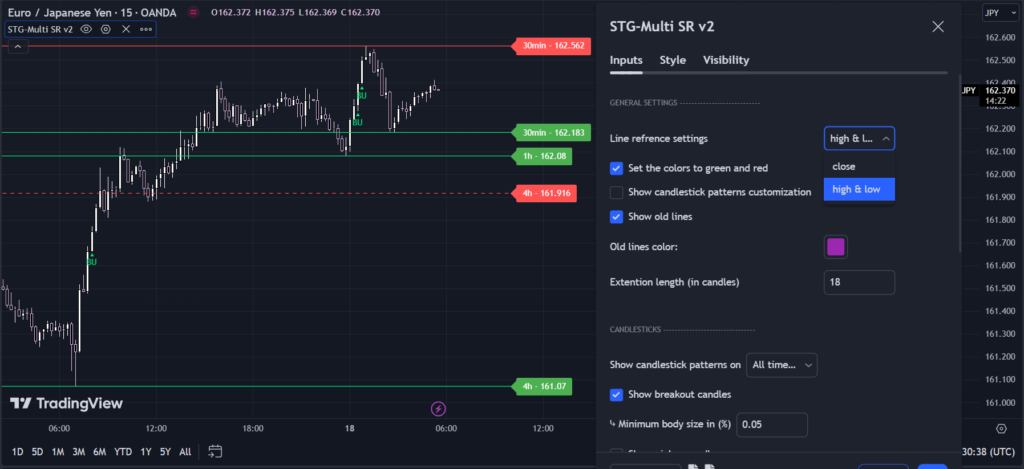
Line Reference Setting
In the “Line Reference Setting” section, you can choose whether the defined levels are based on the close price or the high and low prices. Our recommendation is to use the high and low prices for more comprehensive analysis.
Set the colors to green and red
By enabling the “Set the colors to green and red” option, you can designate support and resistance levels with different colors. Support levels will be displayed in green, while resistance levels will be in red. If this option is disabled, levels will be displayed in the color chosen by you.
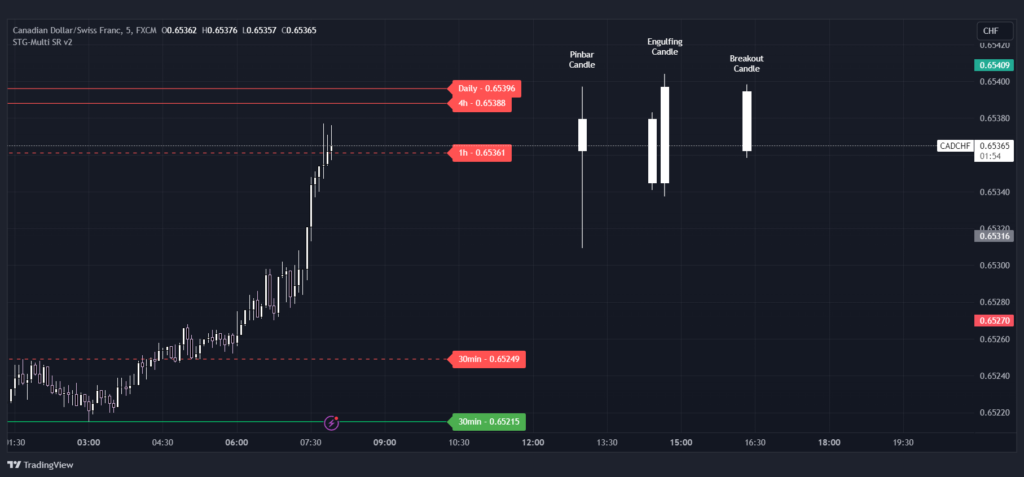
Show candlestick patterns customization:
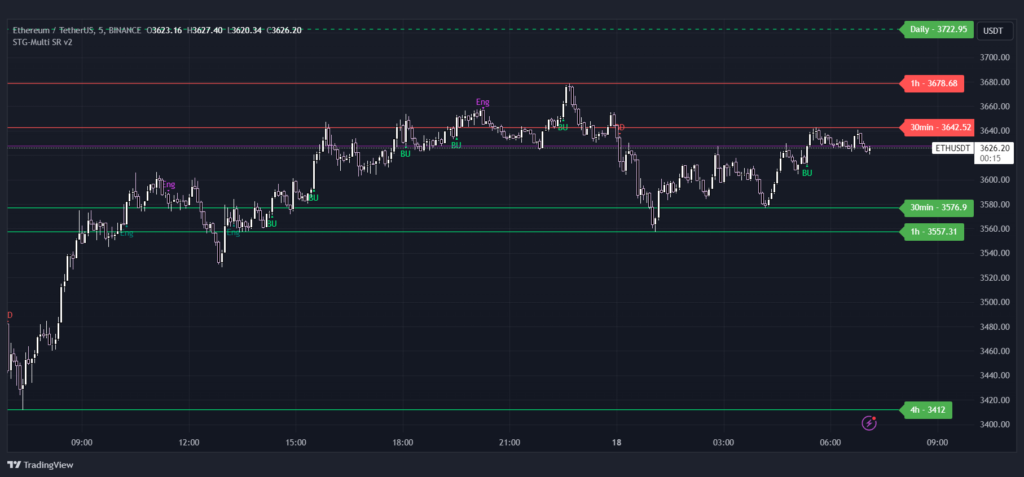
Enabling the “Show candlestick patterns customization” option allows you to visualize examples of candlestick patterns such as Pin Bars, Engulfing, and Breakout candles, precisely tailored to your settings.
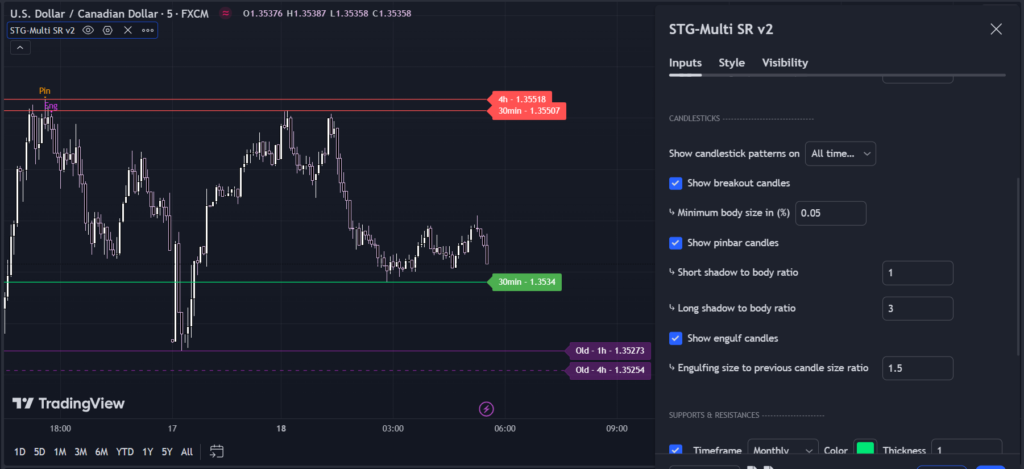
Show Old Lines
By activating “Show Old lines,” you can also view past support and resistance levels that have been consumed by the market (i.e., where the price has interacted with the level and moved away from it).
Extension Length
The “Extension length (in Candles)” determines how many candles forward the labels associated with each support or resistance level, indicating the price of that level and the timeframe, should be displayed, and extends the lines of support and resistance to that point.
Candlesticks settings:
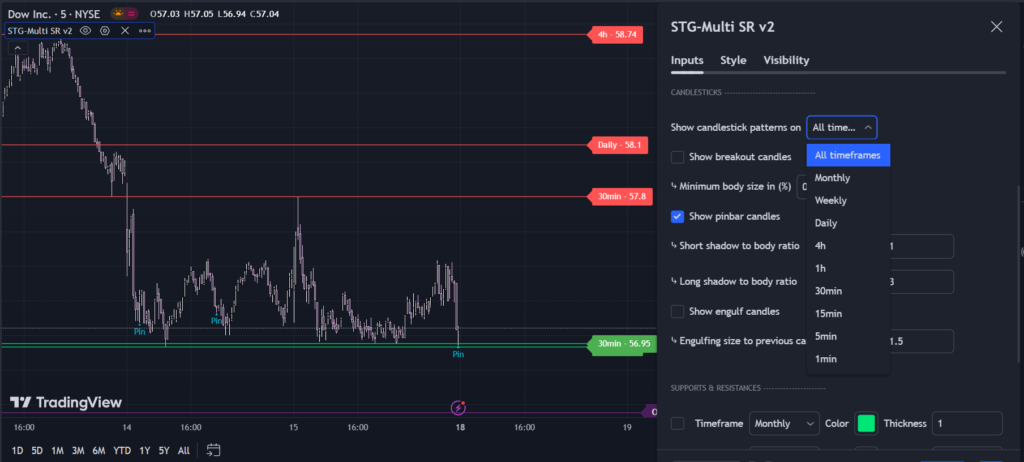
Show Candlestick patterns on [Time Frame]
In the “Show Candlestick Patterns on [Time Frame]” settings section, you can specify whether to display candlestick patterns that occur on support or resistance levels of a particular timeframe. You can select the “All time frames” option to view patterns across all available timeframes.
Show breakout candles
Enabling the “Show breakout candles” option allows you to display breakout candles occurring within the support or resistance range. By increasing the “Minimum body size in(%)” variable, you can identify larger breakout candles.
Show pinbar candles
By activating the “Show pinbar candles” option, you can display pinbar candles occurring within the support or resistance range. Additionally, you can customize the small shadow to body ratio and the large shadow to body ratio.
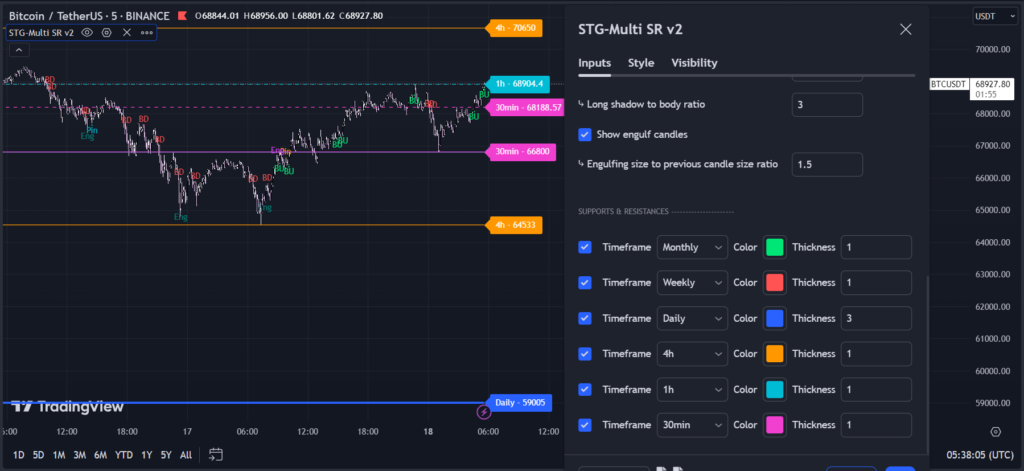
Show Engulf candles
Enabling the “Show Engulf candles” option enables you to display Engulf candles occurring within the support or resistance range. You can also personalize the size ratio of the Engulf pattern to the size of the candle preceding it.
Supports & Resistances
In the “Supports & Resistances” section, you can enable the timeframes for which you want to display their support and resistance levels. You can also customize the color and thickness of each line according to your preferences.
recommended settings:
Please note that depending on the market, currency pair, and timeframe you are trading, the input parameters for the indicator may vary. However, as a general guideline, we suggest the following settings for the indicator inputs:
| Settings | Recommended |
| Line Reference settings | High & Low |
| Show candlestick patterns on | All Timeframes |
| Breakout candle minimum body size | 0.05 |
| Pinbar Short shadow to body ratio | 1 |
| Pinbar long shadow to body ratio | 3 |
| Engulfing size to previous candle size ratio | 1.5 |
Summary:
- Multi Time Frame Analysis: Simultaneously identifies support and resistance levels across multiple timeframes for comprehensive market insights.
- Customizable Input Settings: Tailor the indicator to match your trading style and preferences, ensuring it displays the information most relevant to you.
- Candlestick Pattern Recognition: Highlights candlestick patterns like Engulfing and Pin Bars on these significant support and resistance levels, providing additional confirmation signals.
- Alerts: Stay informed of candlesticks patterns occurrences with customizable alert settings, ensuring you never miss potential trading opportunities.
- Breakout Filtering: Set minimum breakout candle body size to filter out insignificant breakouts, enhancing the quality of trading signals.
Conclusion:
Embrace the power of our Multi-Time Frame Support & Resistance indicator to streamline your trading process. Say goodbye to the hassle of manual level identification and embrace a more efficient and effective approach. With personalized settings, comprehensive analysis across multiple timeframes, and timely alerts, you’ll be equipped to navigate the markets with confidence and precision.
Leave a Reply